Weekly Market Update
Stocks snapped a three-week losing streak and the S&P 500 turned positive for the month, as despite seasonal weakness, more hawkish rhetoric from the Federal Reserve, and concerning energy headlines out of Europe, stocks bounced off oversold market conditions and finished the week with notable strength. Entering this 4-day trading week, most market participants were bracing for more weakness, as European stocks were open Monday and traded poorly as the indefinite closure of the Nord Stream pipeline to Europe coupled with news of OPEC agreeing to cut oil production, reignited concerns of energy crises overseas. However, despite the Federal Reserve recently insisting that it will need to see multiple months of falling inflation before it considers slowing the tightening of financial conditions, we suspect a large part of this week’s strength was from the market sniffing out a potentially soft August CPI figure next Tuesday.
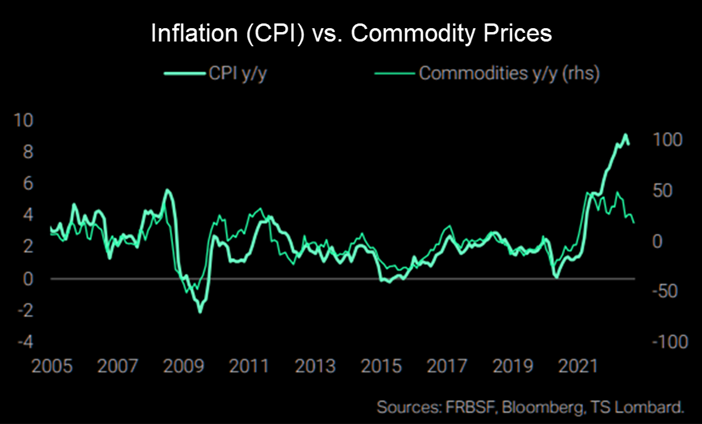
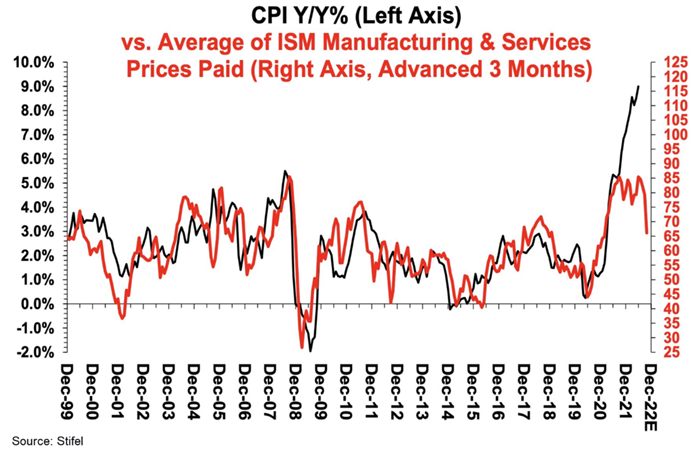
Why might next week’s consumer price index (CPI) undershoot the consensus estimate of 8.1% (per FactSet)? Beyond the fact that gas prices have fallen for 87 consecutive days, we want to share two charts that caught our eye this week. The first chart below plots inflation as measured by the CPI versus year-over-year commodity prices. The second chart is more esoteric but plots the CPI against prices paid by those in the manufacturing and service industries. Until recently, these charts saw very tight correlations, but a sharp divergence has developed at levels not seen in decades and we suspect investors are trying to get ahead of these gaps narrowing after Tuesday morning’s CPI print.
Ian G. Browning, CFA
Managing Director, Investment Strategies | Shareholder


