

WEEKLY mARKET UPDATE 4/5/2024
After rising over 10% in the first quarter, the S&P 500 very narrowly avoided its first +1% weekly decline since early January, as hotter-than-expected inflation data stoked concerns of the Federal Reserve delaying its much-anticipated start of interest rate cuts. The market is still pricing in over 50% odds for a cut in June, but rising commodity prices (i.e., highest oil prices since October) coupled with stubbornly hot inflation data, has caused multiple members of the Fed to recently float the possibility of no cuts this year. As a result, interest rates have climbed, and market volatility has ratcheted higher as the S&P 500 fell about -0.95% on the week. Next week investors get the March consumer price index (CPI) on Wednesday and the unofficial start of first quarter (Q1) earnings season on Friday.
HISTORICAL TAILWINDS
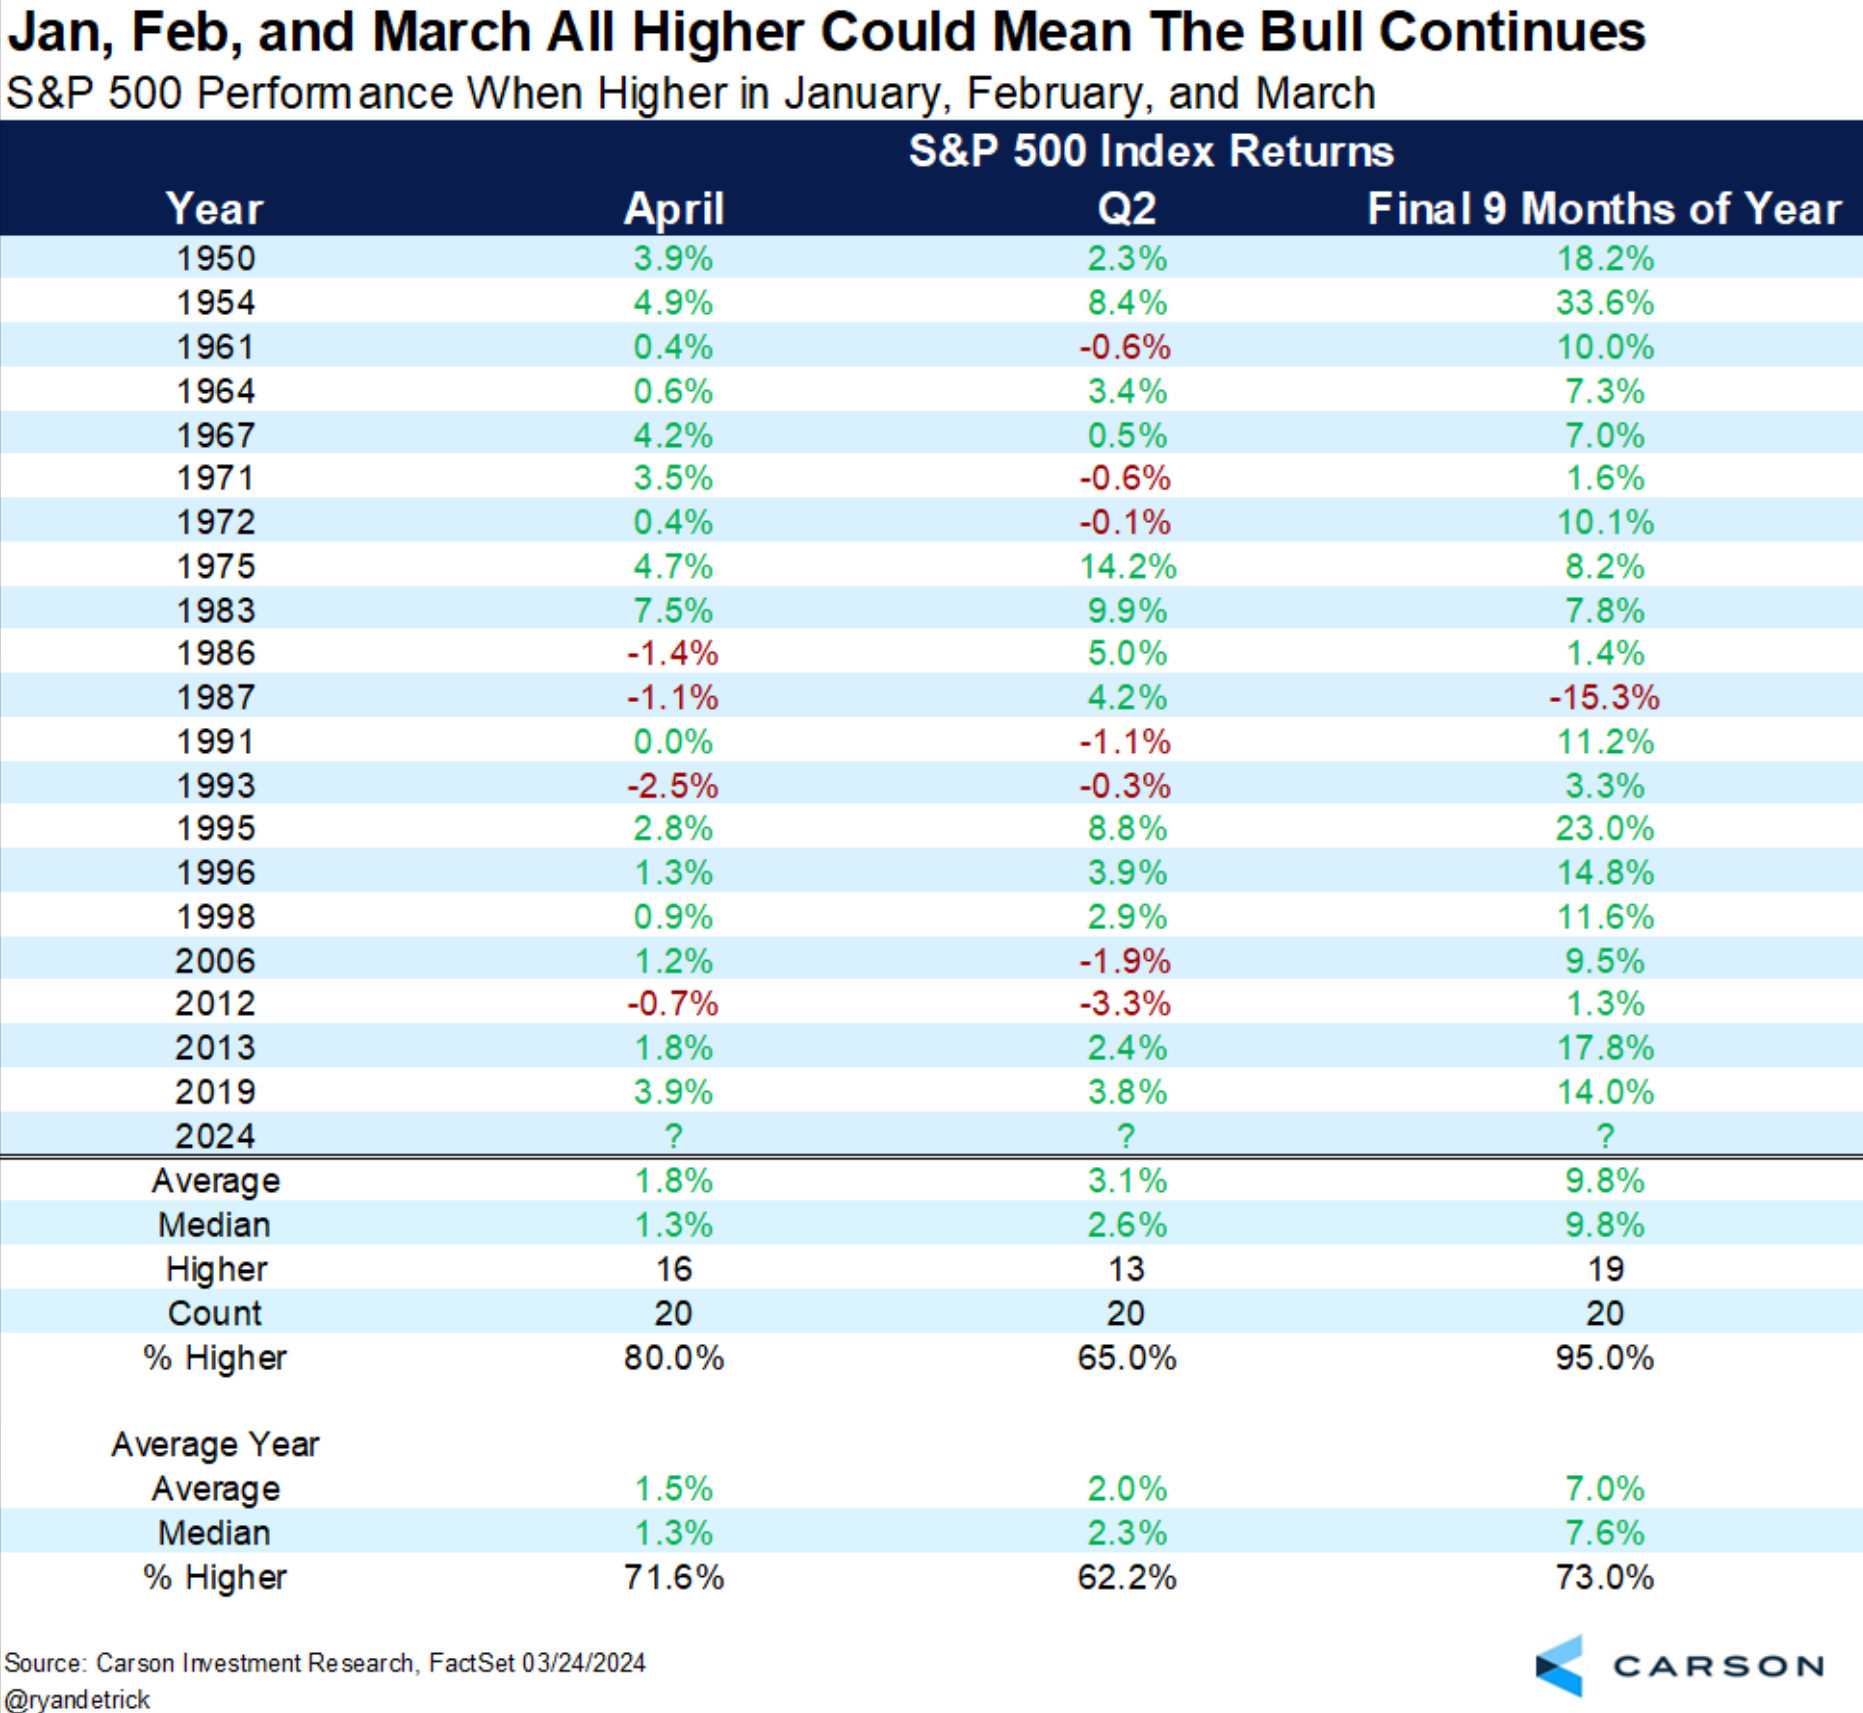
The first three months of 2024 saw the best S&P 500 quarterly returns since 2019 and nearly 40% of trading days in Q1 were record closing highs, the most since Q1 2013. Some investors might think that strong gains to start the year will translate to below average market returns for the final nine months, but historical data shows the opposite. Below is a table from Carson Investment Research that lists every year since 1950 where January, February and March saw positive returns. The final nine months of the year were overwhelmingly positive, with only one outlier, 1987. Certainly, a durable resurgence in inflation could complicate matters, but if the Fed is indeed done hiking and earnings continue to grow, it is hard to be pessimistic on stocks.
Ian G. Browning, CFA
Managing Director, Investment Strategies | Shareholder
Thanks to our clients and friends who have referred business to us over the years.
Your endorsement has been the cornerstone of our growth and our greatest compliment.